Copenhagen

BER Certificates – A Major Infra-Red Survey in Paris (VIII)

2009-12-19:  Still recovering from the shock of the 2009 Copenhagen Accord (!!!) … something has to be said before talking about Paris or France again.  It’s funny looking back, now, to last November …

Wednesday Evening (2009-11-18) – Soccer World Cup Play-Off – Ireland v France – Stade de France 

I admit it … I was not a believer before the match … and was expecting that Ireland would be blown out of the stadium.  However … at the kick-off, I found myself glued to the television.  It was a blatant, intentional and obvious handball by Thierry Henry.  There might be a simple explanation … perhaps, he is a fan of Gaelic Football and somebody gave him a present of a DVD last Christmas !

Après le Match en Irlande 

There is nothing so boring as listening to the English go on … and on … and on … and on … about that 1986 Diego Maradona Goal.  Pay-back time for Las Malvinas ?   In Ireland, let’s stop the whinging … and move on.  We can be a great team – not just a good team – at the next European Championships in 2012 !

Anyway … back to Paris

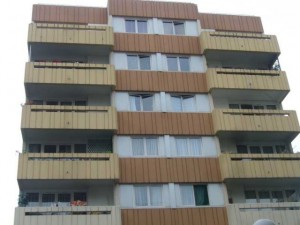
Colour photograph of a Multi-Storey Paris Apartment Block (1975-81).  Click to enlarge.
Colour photograph of a Multi-Storey Paris Apartment Block (1975-81). Click to enlarge.

Early last spring (2009) … as a Special Project in preparation for Copenhagen … some very intelligent people in the Office of the City Mayor (who understand the value, but also the limitations, of marketing campaigns !) … organized that 500 typical buildings of the city, from each of the different historical periods up to the present day, would be surveyed using Infra-Red Thermography.  To complement the building surveys … an aerial survey of the whole city was also carried out.  The results will be placed in the public domain … for all in Paris to see … during 2010.
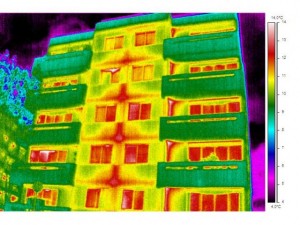
Colour thermograph of the Same Multi-Storey Paris Apartment Block (1975-81).  Parts of the building where most heat is being lost are shown in red.  An accompanying vertical surface temperature scale is also shown on the right of the image.  Click to enlarge.
Colour thermograph of the Same Multi-Storey Paris Apartment Block (1975-81). Parts of the building where most heat is being lost are shown in red. An accompanying vertical surface temperature scale is also shown on the right of the image. Click to enlarge.


The following Project Description was contained in the French Design e-Newsletter ‘Maison à Part’ (www.maisonapart.com), dated Friday 23rd October 2009.  This description is more interesting and informative than a similar description on the City Mayor’s WebSite (www.paris.fr) !

.

Une Thermographie Parisienne Instructive … 
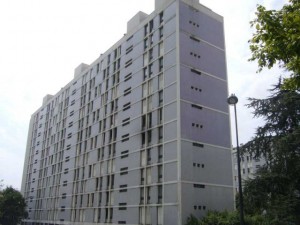
Colour photograph of a Multi-Storey Paris Block of Flats (1945-67).  Click to enlarge.
Colour photograph of a Multi-Storey Paris Block of Flats (1945-67). Click to enlarge.

A l’occasion des Journées Parisiennes de l’Énergie et du Climat du 22 au 25 Octobre 2009, la ville de Paris présente pour la première fois les résultats de la campagne de photographies en infrarouge de la capitale.  Cette carte thermographique permet d’analyser les bâtiments énergivores.
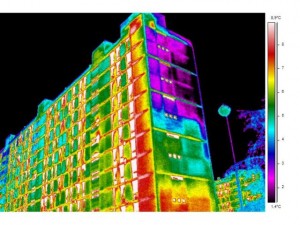


Colour thermograph of the Same Multi-Storey Paris Block of Flats (1945-67).  Parts of the building where most heat is being lost are shown in red.  An accompanying vertical surface temperature scale is also shown on the right of the image.  Click to enlarge.
Colour thermograph of the Same Multi-Storey Paris Block of Flats (1945-67). Parts of the building where most heat is being lost are shown in red. An accompanying vertical surface temperature scale is also shown on the right of the image. Click to enlarge.


A six semaines de l’ouverture de la Conférence des Nations-Unies sur le Changement Climatique à Copenhague, la ville souhaite montrer son engagement dans la lutte contre le réchauffement climatique.  C’est tout l’objet des deuxièmes journées parisiennes énergie et climat, qui se tiendront du 22 au 25 Octobre au Palais Brongniart à Paris.  L’occasion également de découvrir pour la première fois, lors d’une exposition, une carte thermographique des immeubles parisiens.  Réalisée sur 500 bâtiments de style et d’âge différents, elle permet de se rendre compte de toutes les déperditions d’énergie et de trouver ainsi les solutions adéquates.  Chaque Parisien pourra ainsi découvrir sur une carte géante de Paris, son immeuble et sa performance énergétique.

.

Des Prises de Vue Révélatrices … 
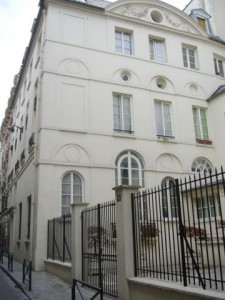
Colour photograph of a Large Paris Residence (Before 1850).  Click to enlarge.
Colour photograph of a Large Paris Residence (Before 1850). Click to enlarge.

Mais d’où viennent ces photos ?   “La nuit du vendredi 6 mars 2009, l’ensemble du territoire parisien a été thermographié depuis un avion” est-il expliqué.  “La thermographie aérienne est une technique qui permet de mesurer la température à la surface des toitures à l’aide d’une caméra infrarouge et d’analyser la déperdition de chaleur des constructions.”   Ainsi, “plus le toit apparaît rouge, plus il est chaud, ce qui signifie qu’une partie de l’énergie dépensée pour chauffer le logement est en fait perdue dans l’atmosphère.”  Une campagne de prises de vue des façades à l’aide d’une caméra thermique – l’hiver en début de soirée, lorsque le thermomètre est en dessous de 5°C – réalisée par la ville permet de compléter l’ensemble.

“Chaque grande période de construction à Paris est analysée sous l’angle architectural et thermique, avec des préconisations de travaux pour chacune” précise les organisateurs de l’exposition.
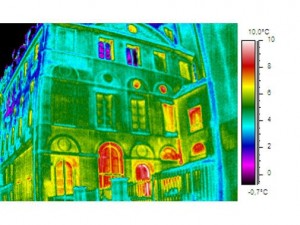
 

Colour thermograph of the Same Large Paris Residence (Before 1850).  Parts of the building where most heat is being lost are shown in red.  An accompanying vertical surface temperature scale is also shown on the right of the image.  Click to enlarge.
Colour thermograph of the Same Large Paris Residence (Before 1850). Parts of the building where most heat is being lost are shown in red. An accompanying vertical surface temperature scale is also shown on the right of the image. Click to enlarge.


Courant 2010, un Site Internet représentant chaque type d’immeuble devrait être mis en place, grâce auquel chacun pourra “tirer des préconisations générales” en matière d’économies d’énergie pour son propre immeuble, même si “cette photographie ne remplace pas un diagnostic thermique”, a précisé à l’AFP l’adjoint à l’environnement de la Mairie de Paris, Denis Baupin.  Le Site montrera quatre photos de façade par bâtiment, la couleur rouge symbolisant les pertes d’énergie les plus importantes.

.

.

END

Enhanced by Zemanta

Harmonized Indicators of Building GHG & Energy Performance

[ BER Certificates (VII) : UNFCCC COP-15 : CIB W108 – Climate Change and the Built Environment ]

2009-12-18:  Even before the gatherings of UNFCCC COP-15 & Kyoto Protocol MOP-5 began … some remarkably positive progress on difficult technical issues had already been made at international level.  Hot off the presses … comes an important document from the United Nations Environment Programme (UNEP) Sustainable Buildings & Construction Initiative (SBCI): ‘Common Carbon Metric’ (December 2009), which was specifically prepared for presentation at Copenhagen.

Leading experts from around the world have developed a standardized method of measuring a building’s carbon footprint … allowing greenhouse gas emissions from buildings anywhere in the world to be consistently assessed and compared.  In the case of existing buildings, improvements can also be measured.

This harmonized method for MRV (Measurable, Reportable & Verifiable) GHG Emissions and Energy Use provides the basis for establishing baselines, performance benchmarking, and monitoring building performance improvements.  These activities are, in turn, fundamental in informing international mechanisms for carbon trading, policy development and analysis, and progress reporting on the mitigation of GHG Emissions from buildings.  Policy and decision makers can produce reports from the data collected through these Metrics/Indicators for jurisdictions, regions, large building stock owners, cities or at a national level to form baselines that can be used to set targets and show improvements in carbon mitigation throughout the building sector.

I am pleased to say that Monsieur Jean-Luc Salagnac (CSTB France), Co-Ordinator of CIB Working Commission 108 : Climate Change and the Built Environment, was directly involved in its development …

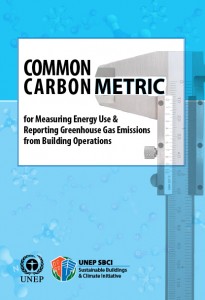
Colour image showing the cover page of the UNEP-SBCI 'Common Carbon Metric', recently published in December 2009.  Click to enlarge.
Colour image showing the cover page of the UNEP-SBCI ‘Common Carbon Metric’, recently published in December 2009. Click to enlarge.

 UNEP-SBCI ‘Common Carbon Metric’ (December 2009)  for measuring, reporting and verifying (mrv) greenhouse gas emissions and energy consumption of buildings in use.

Click the Link above to read/download PDF File (1.97 MB)

.

Recommendations on Implementing the New Harmonized Approach

All research, design and teaching disciplines involved in the European Building Sector … extending right across to any person who works on a construction site or has any part to play in managing, maintaining, servicing or operating a building … should familiarize himself/herself/themselves with the contents of this document.

As soon as practicable … calculation methods, computer software packages, reports, BER Certificates, etc … and working practices generally … should all be revised and updated to take account of this newly harmonized approach.

Whatever the outcome from Copenhagen in December 2009 … in terms of the presentation of priorities … these should now be switched around … with a strong first emphasis being placed on ‘GHG Emissions’ from Buildings … followed by, and secondly, ‘Energy Consumption’ resulting from the Use/Occupation of Buildings.

What is Measured in the UNEP-SBCI ‘Common Carbon Metric’ ?

While all stages of a building’s life cycle produce GHG Emissions, building use accounts for 80-90% of these emissions … resulting from energy consumed mainly for heating, cooling, ventilation, lighting and electric/electronic appliances.  This, therefore, is the stage of the building’s life cycle that is the focus of the ‘Common Carbon Metric’.

The following Metrics/Indicators shall be used to compile consistent and comparable data:

1.  Energy Intensity = kWh/m2/year (kilo Watt hours per square metre per year)

Scope: Emissions associated with building energy end-use defined in Appendix 1 are included; purchased electricity, purchased ‘coolth'(opposite of warmth)/steam/heat, and/or on-site generated power used to support the building operations.  If available, emissions associated with fugitives and refrigerants used in building operations should be reported separately.

If available, occupancy data should be correlated with the building area to allow Energy Intensity per occupant (o) to be calculated = kWh/o/year.

GHG Emissions are calculated by multiplying the above Energy Intensity times the official GHG emission coefficients, for the year of reporting, for each fuel source used (see Appendix 3).

2.  Carbon Intensity = kgCO2e/m2/year or kgCO2e/o/year (kilograms of carbon dioxide equivalent per square metre or per occupant per year)

Note: GHG conversion factors for each fuel type shall be the same as those used under national reporting for flexible mechanisms for the Kyoto Protocol for the six GHG Gases (see Appendix 4).

Why Buildings ?

The environmental footprint of the Building Sector includes: 40% of energy use, 30% raw materials use, 25% of solid waste, 25% water use, and 12% of land use.  While this new document focuses on the scope of emissions related to energy use of building operations (see Appendix 1), future metrics are required to address these other impacts in addition to social and financial impacts.  At this time the UN’s top priority is climate change … and the building sector is responsible for more than one third of Global GHG Emissions and is, in most countries, the largest emissions source.  While 80-90% of the energy used by the building is consumed during the use (or operational) stage of a building’s life cycle (for heating, cooling, ventilation, lighting, appliances, etc.), the other 10-20% (figure varies according to the life of the building), is consumed during extraction and processing of raw materials, manufacturing of products, construction and de-construction.  Furthermore, significant energy is used in transporting occupants, goods and services to and from the building.

The UNEP-WMO Intergovernmental Panel on Climate Change (IPCC) 4th Assessment Report estimated that building-related GHG Emissions reached 8.6 billion metric tons (t) CO2equivalent (e) in 2004, and could nearly double by 2030, reaching 15.6 billion tCO2e under their high-growth scenario.  The report further concluded that the building sector has the largest potential for reducing GHG Emissions and is relatively independent of the price of carbon reduction (cost per tCO2e) applied.  With proven and commercially available technologies, the energy consumption in both new and existing buildings can be cut by an estimated 30-50% without significantly increasing investment costs.  Energy savings can be achieved through a range of measures including smart design, improved insulation, low-energy appliances, high efficiency ventilation and heating/cooling systems, and conservation behaviour by building occupants.

.

.

END

Enhanced by Zemanta

FCCC COP-15: Historical Responsibility & Poverty Reduction ?

2009-12-16:  ‘Chaotic’ is not the only word to describe what is happening right now in Copenhagen !   A few additional parliamentary expletives are required.  Is it just me … or is it obvious to everyone … that the Danes could not organize an orgy at an International Golf Tournament ?

What the world urgently needed was an ambitious, legally binding agreement … a Kyoto II Protocol, for want of a better title … to slot into place when the 1st Commitment Period ends in 2012.  What we may end up with is an ambiguous ‘political’ agreement … which will be worth approximately 1 cent more than the paper on which it will be scrawled.

There is something definitely rotten in the State of Denmark !   Multiple drafts of the same working document circulating at the same time … backroom meetings away from public scrutiny … greedy developed countries trying to avoid responsibility and action … strutting, self-important NGO’s thinking that they know all the answers … etc., etc … kill any confidence in the process stone dead.  These are not the ways of Sustainable Social Partnership.

However … at a far distance from the hustle and bustle … it can be observed that Interesting Side Events are taking place … and Thought Provoking Reports are being presented … before, during and after the main gatherings between the 7th and 18th December 2009:

  • 15th Session of the Conference of the Parties (COP-15) to the United Nations Framework Convention on Climate Change (UNFCCC) ;
  • 5th Meeting of the Parties (MOP-5) to the Kyoto Protocol.

.

African Countries are not the only Group having difficulty with what is/is not happening in Copenhagen …

Two recent Discussion Papers from The Energy & Resources Institute (TERI), in India, are worth bringing to your attention.  Both raise issues which are not very popular in this part of the world.  And … it so happens that Dr. Rajendra K Pachauri – Director-General of TERI … is also Chairman of the WMO-UNEP Intergovernmental Panel on Climate Change (IPCC) !

  1. Right to Sustainable Development: An Ethical Approach to Climate Change (December 2009), by Leena Srivastava, Neha Pahuja, Manish Shrivastava & Prabhat Upadhyay.  PDF File, 228 Kb.  Click link to read and/or download.  Discusses ideas such as: ‘equity’, ‘fairness’, ‘historical responsibility’ (of UNFCCC Annex I Countries), ‘climate justice’, etc.
  2. Linking Climate Action & Poverty Alleviation – An Approach to Informed Decision-Making (December 2009), by Atul Kumar.  PDF File, 488 Kb.  Click link to read and/or download.

Notes:

To gain worldwide acceptance – across developed, developing and least developed regions of the world – and to have a reasonable chance of reliable implementation in those disparate regions … mitigation of, and adaptation to, climate change, including variability and extremes, must be fully compatible with the concept of Sustainable Human & Social Development.  This is clearly elaborated in both the 1992 UNFCCC and the 1997 Kyoto Protocol.

To be clear among ourselves on this island … Ireland is specifically named (without any qualification), among other Developed Countries … in Annex I and Annex II of the 1992 United Nations Framework Convention on Climate Change (UNFCCC) … and in Annex B of the 1997 Kyoto Protocol, which is legally binding.  The European Union is not mentioned, at all, in either document.

It is of concern to note that although India ratified the 2006 United Nations Convention on the Rights of Persons with Disabilities (CRPD) in October 2007 – TERI (India) has very recently placed a Document (No.1 above) in the public domain, at Copenhagen, which actively forbids content extraction by people with activity limitations for the purposes of equitable accessibility !   Joined-up thinking !?!?

.

.

END

Enhanced by Zemanta

Europe Pretending to Lead the Way on Climate Change ?

2009-03-06:  In August 2008 … I travelled to Bengaluru (Bangalore), in the south of India, to attend a Fire Conference organized by the Fire & Safety Association of India (FSAI).  A year earlier, I had been with them in Chennai (Madras), also in the south.  My own father, Con, had been a teacher in the north of the country from about 1930 onwards, so I had always wanted to see the country for myself.  He was caught there, by the way, during the 2nd World War and could only travel back home, to Ireland, in 1947.


Much to the amusement of local people, the means of transport I decided to use … guaranteeing a vivid experience of the varied local sights, sounds and smells … was an Auto-Rickshaw … a three-wheeled scooter, with an open yellow cab on the back.  It is a common form of transport in the large cities of India.  This was a serious effort … no messing around in the sealed cocoon of an air-conditioned taxi !


These 2 Photographs were taken during the rush hour traffic, early one morning, in Bengaluru.  The roads were jammed solid with traffic … every type of vehicle … crawling along at a snail’s pace.  The driver of my Auto-Rickshaw was bent over the handlebars … always coughing … heaving a loud, jagged-rough, deep cough … 


Colour Photograph showing the View from Inside an Auto-Rickshaw during Morning Rush Hour Traffic in Bengaluru, Southern India. Click to enlarge. Photograph taken by CJ Walsh. 2008-08-07.


The reason for his coughing … you can see an actual pollution haze to the right of the frame below … a haze so thick, that it almost had to be parted with your hands in order to see ahead …


Colour Photograph showing the Pollution Haze during Morning Rush Hour Traffic in Bengaluru, Southern India. Click to enlarge. Photograph taken by CJ Walsh. 2008-08-07.


This is the reality of everyday life on the ground in one of the economically more advanced ‘developing’ countries – Brazil, Russia, India, China & South Africa (BRICS) – where far too many people are chasing the dream of our reality in Europe … a reality created from the plunder, over hundreds of years, of those same ‘developing’ countries.


This is why the European Union must lead by ‘real’ example when it comes to Climate Change Mitigation and Adaptation.  But, is it ‘real’ ????


This is why Ireland must begin to properly face up to its responsibilities under Kyoto I, the EU 2020 Targets, and a probable Kyoto II International Agreement to be finalized in Copenhagen towards the end of 2009.


This is why the United States of America must stop prancing around our fragile planet like a spoiled, immature child … and engage seriously with the rest of us.  We have lost all patience ! 


Copenhagen & the European Union … 


On 28th January 2009, the European Commission issued COM(2009) 39 final


Communication from the Commission to the European Parliament, the Council, the European Economic and Social Committee & the Committee of the Regions – Towards a Comprehensive Climate Change Agreement in Copenhagen.


On Page 2 of the Communication, the Executive Summary commences …


‘ The successful conclusion of the international climate change negotiations in Copenhagen at the end of 2009 is a key priority for the European Union (EU).  Now that the Climate & Energy package has been adopted, the EU must step up its contacts with third Countries, both in the UN context and beyond.’


A paragraph later, it continues …


‘ In order to limit the global average temperature increase to not more than 2°C above pre-industrial levels, developed countries as a group should reduce their emissions to 30% below 1990 levels in 2020.  The EU has set the example by committing to a 20% reduction in its emissions compared to 1990 levels by 2020, irrespective of whether or not an international agreement is concluded.  This is by far the most ambitious commitment by any country or group of countries in the world for the post-2012 period.


The EU is willing to go further and sign up to a 30% reduction target in the context of a sufficiently ambitious and comprehensive international agreement that provides for comparable reductions by other developed countries, and appropriate actions by developing countries.  Developing countries as a group should limit the growth of their emissions to 15-30% below business as usual.’


.


.


END

Enhanced by Zemanta